> ## Documentation Index
> Fetch the complete documentation index at: https://docs.together.ai/llms.txt
> Use this file to discover all available pages before exploring further.
# Cost analytics
> Track daily Together AI spend and billable units by product, line item, project, or API key.
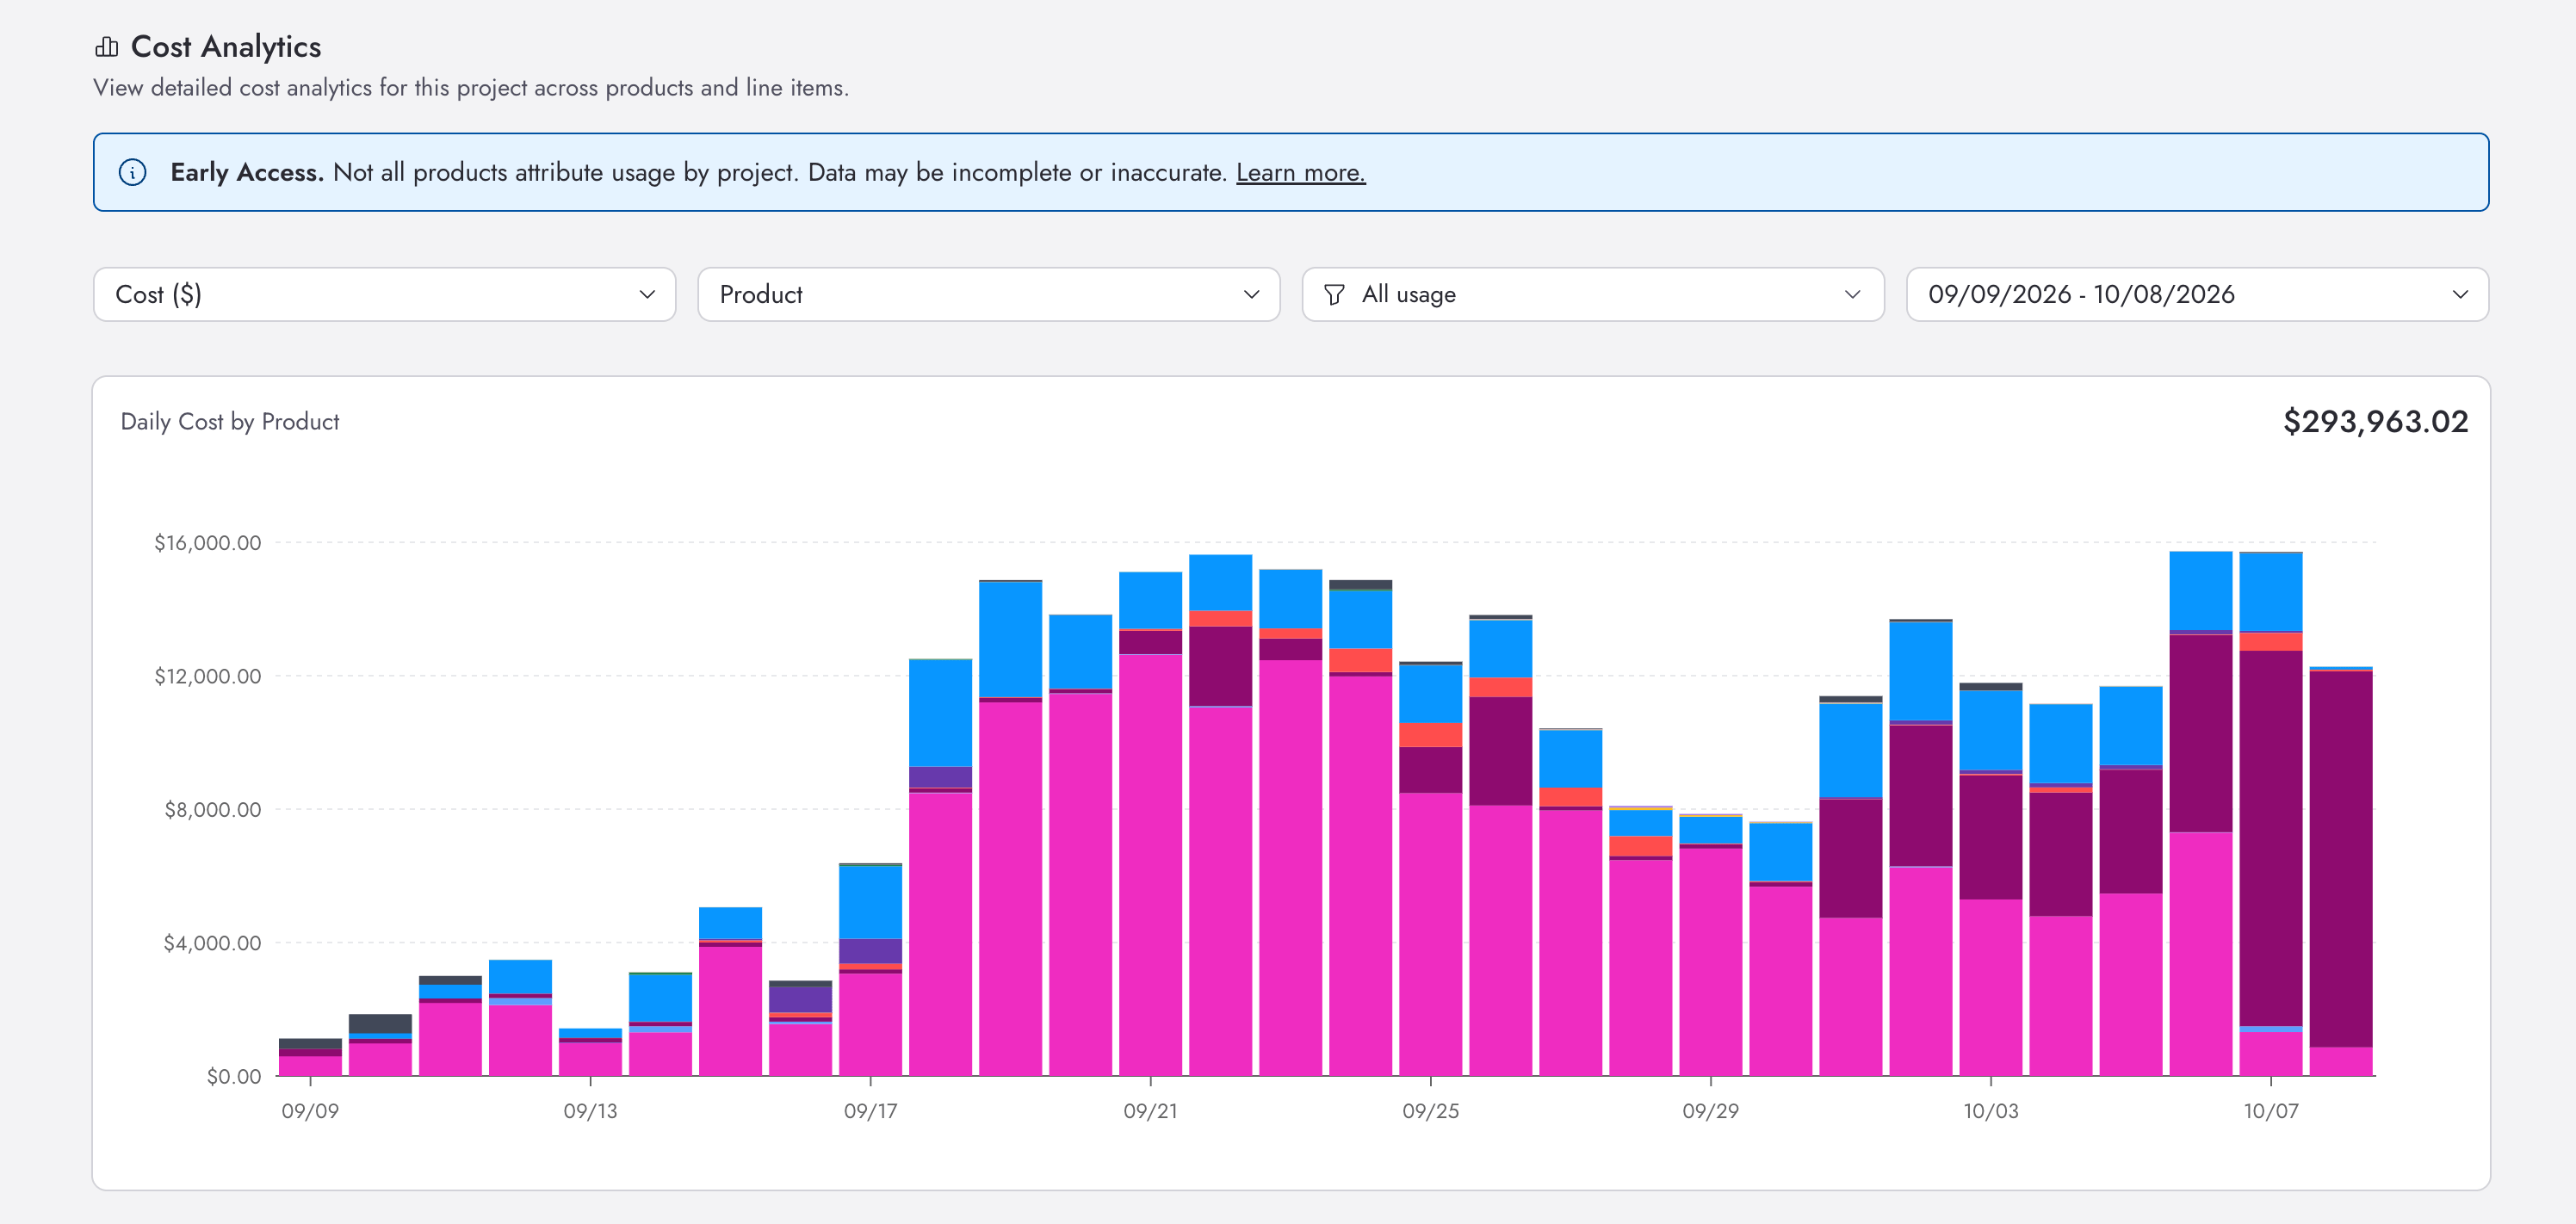
The cost analytics dashboard charts your daily spend or billable units, such as tokens, so you can see which products, projects, and API keys drive your usage over time.
 ## Open cost analytics
* **Organization:** Open [organization cost analytics](https://api.together.ai/settings/organization/~current/cost-analytics) to see spend across every project. Only organization admins can view this page.
* **Project:** Open your [project's cost analytics page](https://api.together.ai/settings/projects/~current/cost-analytics) to scope the view to a single project. Project cost analytics is in early access, and not all products attribute usage to a project yet, so project totals can be incomplete. External collaborators can't view it.
To see usage for the current billing period, open your [billing settings](https://api.together.ai/settings/organization/~current/billing) and select **See current monthly invoice usage** on the **Monthly spend** card.
## Choose a measure and grouping
Use **Measure** to choose what the chart shows:
* **Cost (\$):** Daily spend in US dollars. This is the default.
* **Units:** Daily billable units, such as tokens. Totals and tooltips show unit counts instead of dollar amounts.
Use **Group by** to break the chart down:
* **Product:** Each product, such as serverless inference or storage.
* **Line items:** Each billable line item.
* **Project (beta):** Each project in your organization. Available on organization cost analytics only.
* **API key (beta):** Each API key.
With **Units**, grouping by product, project, or API key adds up the unit counts of every line item in the group. Group by **Line items** to see each item's count on its own.
## Filter and set the time range
* **Filter:** Include or exclude specific series from the current grouping. The filter shows **All usage** until you apply one. Filtering isn't available when you group by line items.
* **Time range:** Choose **Yesterday**, **Last 7 Days**, or **Last 30 Days** (the default), or pick start and end dates on the calendar. A range can cover up to 31 days. All dates are in UTC.
The total in the top right covers all usage in the selected period, even when a filter hides some of it from the chart. When you group by project or API key, the chart leaves out usage that isn't attributed to one, but the total still includes it.
## Review line items
The **Breakdown** table below the chart lists every billable line item for each day in the selected time range, with its quantity, unit price, and amount. It always shows all line items for the time range, regardless of the chart's **Measure**, **Group by**, and **Filter** settings.
* **Search:** Find line items by name or by the attributes listed under each name.
* **Sort:** Sort rows by quantity, unit price, or amount.
* **Download CSV:** Export every line item in the time range, including rows hidden by your search. The file has `Date`, `Line Item`, `Dimensions`, `Quantity`, `Unit Price (USD)`, and `Amount (USD)` columns.
## Next steps
Cap spend, set up auto-recharge, and trace a spend increase to its source.
Pull cost-annotated usage line items into your own reporting.
This documentation is built and hosted on [Mintlify](https://mintlify.com), a developer documentation platform.
## Open cost analytics
* **Organization:** Open [organization cost analytics](https://api.together.ai/settings/organization/~current/cost-analytics) to see spend across every project. Only organization admins can view this page.
* **Project:** Open your [project's cost analytics page](https://api.together.ai/settings/projects/~current/cost-analytics) to scope the view to a single project. Project cost analytics is in early access, and not all products attribute usage to a project yet, so project totals can be incomplete. External collaborators can't view it.
To see usage for the current billing period, open your [billing settings](https://api.together.ai/settings/organization/~current/billing) and select **See current monthly invoice usage** on the **Monthly spend** card.
## Choose a measure and grouping
Use **Measure** to choose what the chart shows:
* **Cost (\$):** Daily spend in US dollars. This is the default.
* **Units:** Daily billable units, such as tokens. Totals and tooltips show unit counts instead of dollar amounts.
Use **Group by** to break the chart down:
* **Product:** Each product, such as serverless inference or storage.
* **Line items:** Each billable line item.
* **Project (beta):** Each project in your organization. Available on organization cost analytics only.
* **API key (beta):** Each API key.
With **Units**, grouping by product, project, or API key adds up the unit counts of every line item in the group. Group by **Line items** to see each item's count on its own.
## Filter and set the time range
* **Filter:** Include or exclude specific series from the current grouping. The filter shows **All usage** until you apply one. Filtering isn't available when you group by line items.
* **Time range:** Choose **Yesterday**, **Last 7 Days**, or **Last 30 Days** (the default), or pick start and end dates on the calendar. A range can cover up to 31 days. All dates are in UTC.
The total in the top right covers all usage in the selected period, even when a filter hides some of it from the chart. When you group by project or API key, the chart leaves out usage that isn't attributed to one, but the total still includes it.
## Review line items
The **Breakdown** table below the chart lists every billable line item for each day in the selected time range, with its quantity, unit price, and amount. It always shows all line items for the time range, regardless of the chart's **Measure**, **Group by**, and **Filter** settings.
* **Search:** Find line items by name or by the attributes listed under each name.
* **Sort:** Sort rows by quantity, unit price, or amount.
* **Download CSV:** Export every line item in the time range, including rows hidden by your search. The file has `Date`, `Line Item`, `Dimensions`, `Quantity`, `Unit Price (USD)`, and `Amount (USD)` columns.
## Next steps
Cap spend, set up auto-recharge, and trace a spend increase to its source.
Pull cost-annotated usage line items into your own reporting.
This documentation is built and hosted on [Mintlify](https://mintlify.com), a developer documentation platform.