- Better reasoning
- More complex tasks (e.g., advanced data analysis or mathematics)
- Producing tangible results such as charts
- Immediate testing (and correcting) of the produced output.
1. Prerequisites
Create amain.ipynb file and save your Together & E2B API keys in there.
Get the E2B API key here and the Together AI API key here. Download the CSV file from here and upload it to the same directory as your program. Rename it to data.csv.
2. Install the SDKs
Shell
3. Define your model and system prompt
In the following code snippet, we’ll define our API keys, our model of choice, and our system prompt. You can pick the model of your choice by uncommenting it. There are some recommended models that are great at code generation, but you can add a different one from here. For the system prompt, we tell the model it’s a data scientist and give it some information about the uploaded CSV. You can choose different data but will need to update the instructions accordingly.Python
4. Add code interpreting capabilities and initialize the model
Now we define the function that will use the E2B code interpreter. Every time the LLM assistant decides that it needs to execute code, this function will be used. Read more about the Code Interpreter SDK here. We also initialize the Together AI client. The function for matching code blocks is important because we need to pick the right part of the output that contains the code produced by the LLM. The chat function takes care of the interaction with the LLM. It calls the E2B code interpreter anytime there is a code to be run.Python
5. Upload the dataset
The CSV data is uploaded programmatically, not via AI-generated code. The code interpreter by E2B runs inside the E2B sandbox. Read more about the file upload here.Python
6. Put everything together
Finally we put everything together and let the AI assistant upload the data, run an analysis, and generate a PNG file with a chart. You can update the task for the assistant in this step. If you decide to change the CSV file you are using, don’t forget to update the prompt too.Python
7. Run the program and see the results
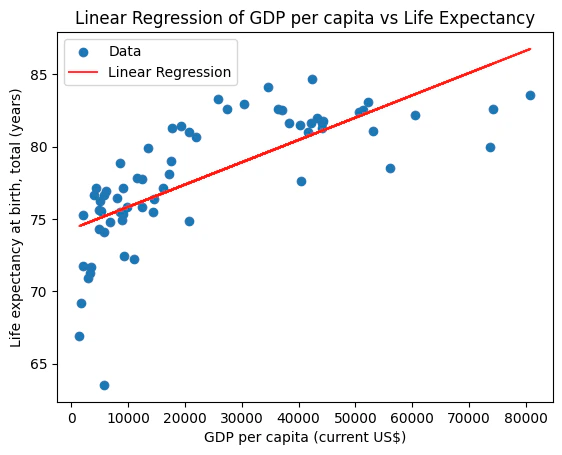
The resulting chart is generated within the notebook. The plot shows the linear regression of the relationship between GDP per capita and life expectancy from the CSV data:Python