

The metrics endpoint is in beta. The host and path are subject to change, and access may need to be enabled for your organization. Confirm availability with your Together AI contact before you build against it.
Requirements
- A Together API key set as
TOGETHER_API_KEYin your terminal. - The Together CLI installed.
- Docker with the Compose plugin.
- A dedicated endpoint serving traffic. The next section creates one if you don’t have one already.
Step 1: Deploy an endpoint and send traffic
The dashboard only shows data for endpoints that are serving requests. If you already have a dedicated endpoint taking traffic, skip to Find your organization ID. Deploy a small model on its default hardware:tg beta endpoints get, passing the deployment ID from the deploy output. Once the deployment reaches DEPLOYMENT_STATE_READY, send it a steady trickle of requests so every panel has data. Leave this loop running while you set up Grafana:
your_project_slug/grafana-demo with the endpoint string from the deploy output. Keep "stream": true in the request body, because the time-to-first-token panels only count streaming requests. See the quickstart for the full deploy walkthrough.
Step 2: Find your organization ID
The metrics endpoint is scoped to your organization, so the scrape path needs your organization ID. Print it with the CLI:org_ value. Then confirm the metrics endpoint responds for your organization:
# TYPE lines followed by series like edge_inference_requests_total{endpoint_id="ep_...",status_code="200"}. An empty response means no dedicated endpoint in the organization has served traffic recently.
Step 3: Run Prometheus and Grafana
Create a directory with three files: a Compose file, a Prometheus scrape config, and a Grafana data source definition.docker-compose.yml runs the two services:
docker-compose.yml
prometheus.yml scrapes the metrics endpoint once a minute. Fill in your API key and organization ID:
prometheus.yml
grafana-datasource.yml pre-configures Grafana with Prometheus as its data source, so the dashboard import can bind to it directly:
grafana-datasource.yml
timeInterval value must match the scrape_interval in prometheus.yml. Grafana uses it to size rate windows, and without it every rate and percentile panel on the dashboard stays empty because Grafana assumes the default 15-second scrape interval.
Start the stack:
together-endpoint-metrics target reports UP. The target stays in an unknown state until the first scrape completes, usually within a minute.
Step 4: Import the dashboard
Together AI publishes an example dashboard for these metrics in the together-cookbook repository. It requires Grafana 10.2 or later and works with any Prometheus data source, including the local stack above.-
Download the dashboard JSON:
-
Open Grafana at http://localhost:3000 and sign in. The default credentials are
admin/admin. - Go to Dashboards, select New, then Import.
-
Upload
together-dedicated-endpoints-dashboard.json, select the Prometheus data source when prompted, and select Import.
Step 5: Read the dashboard
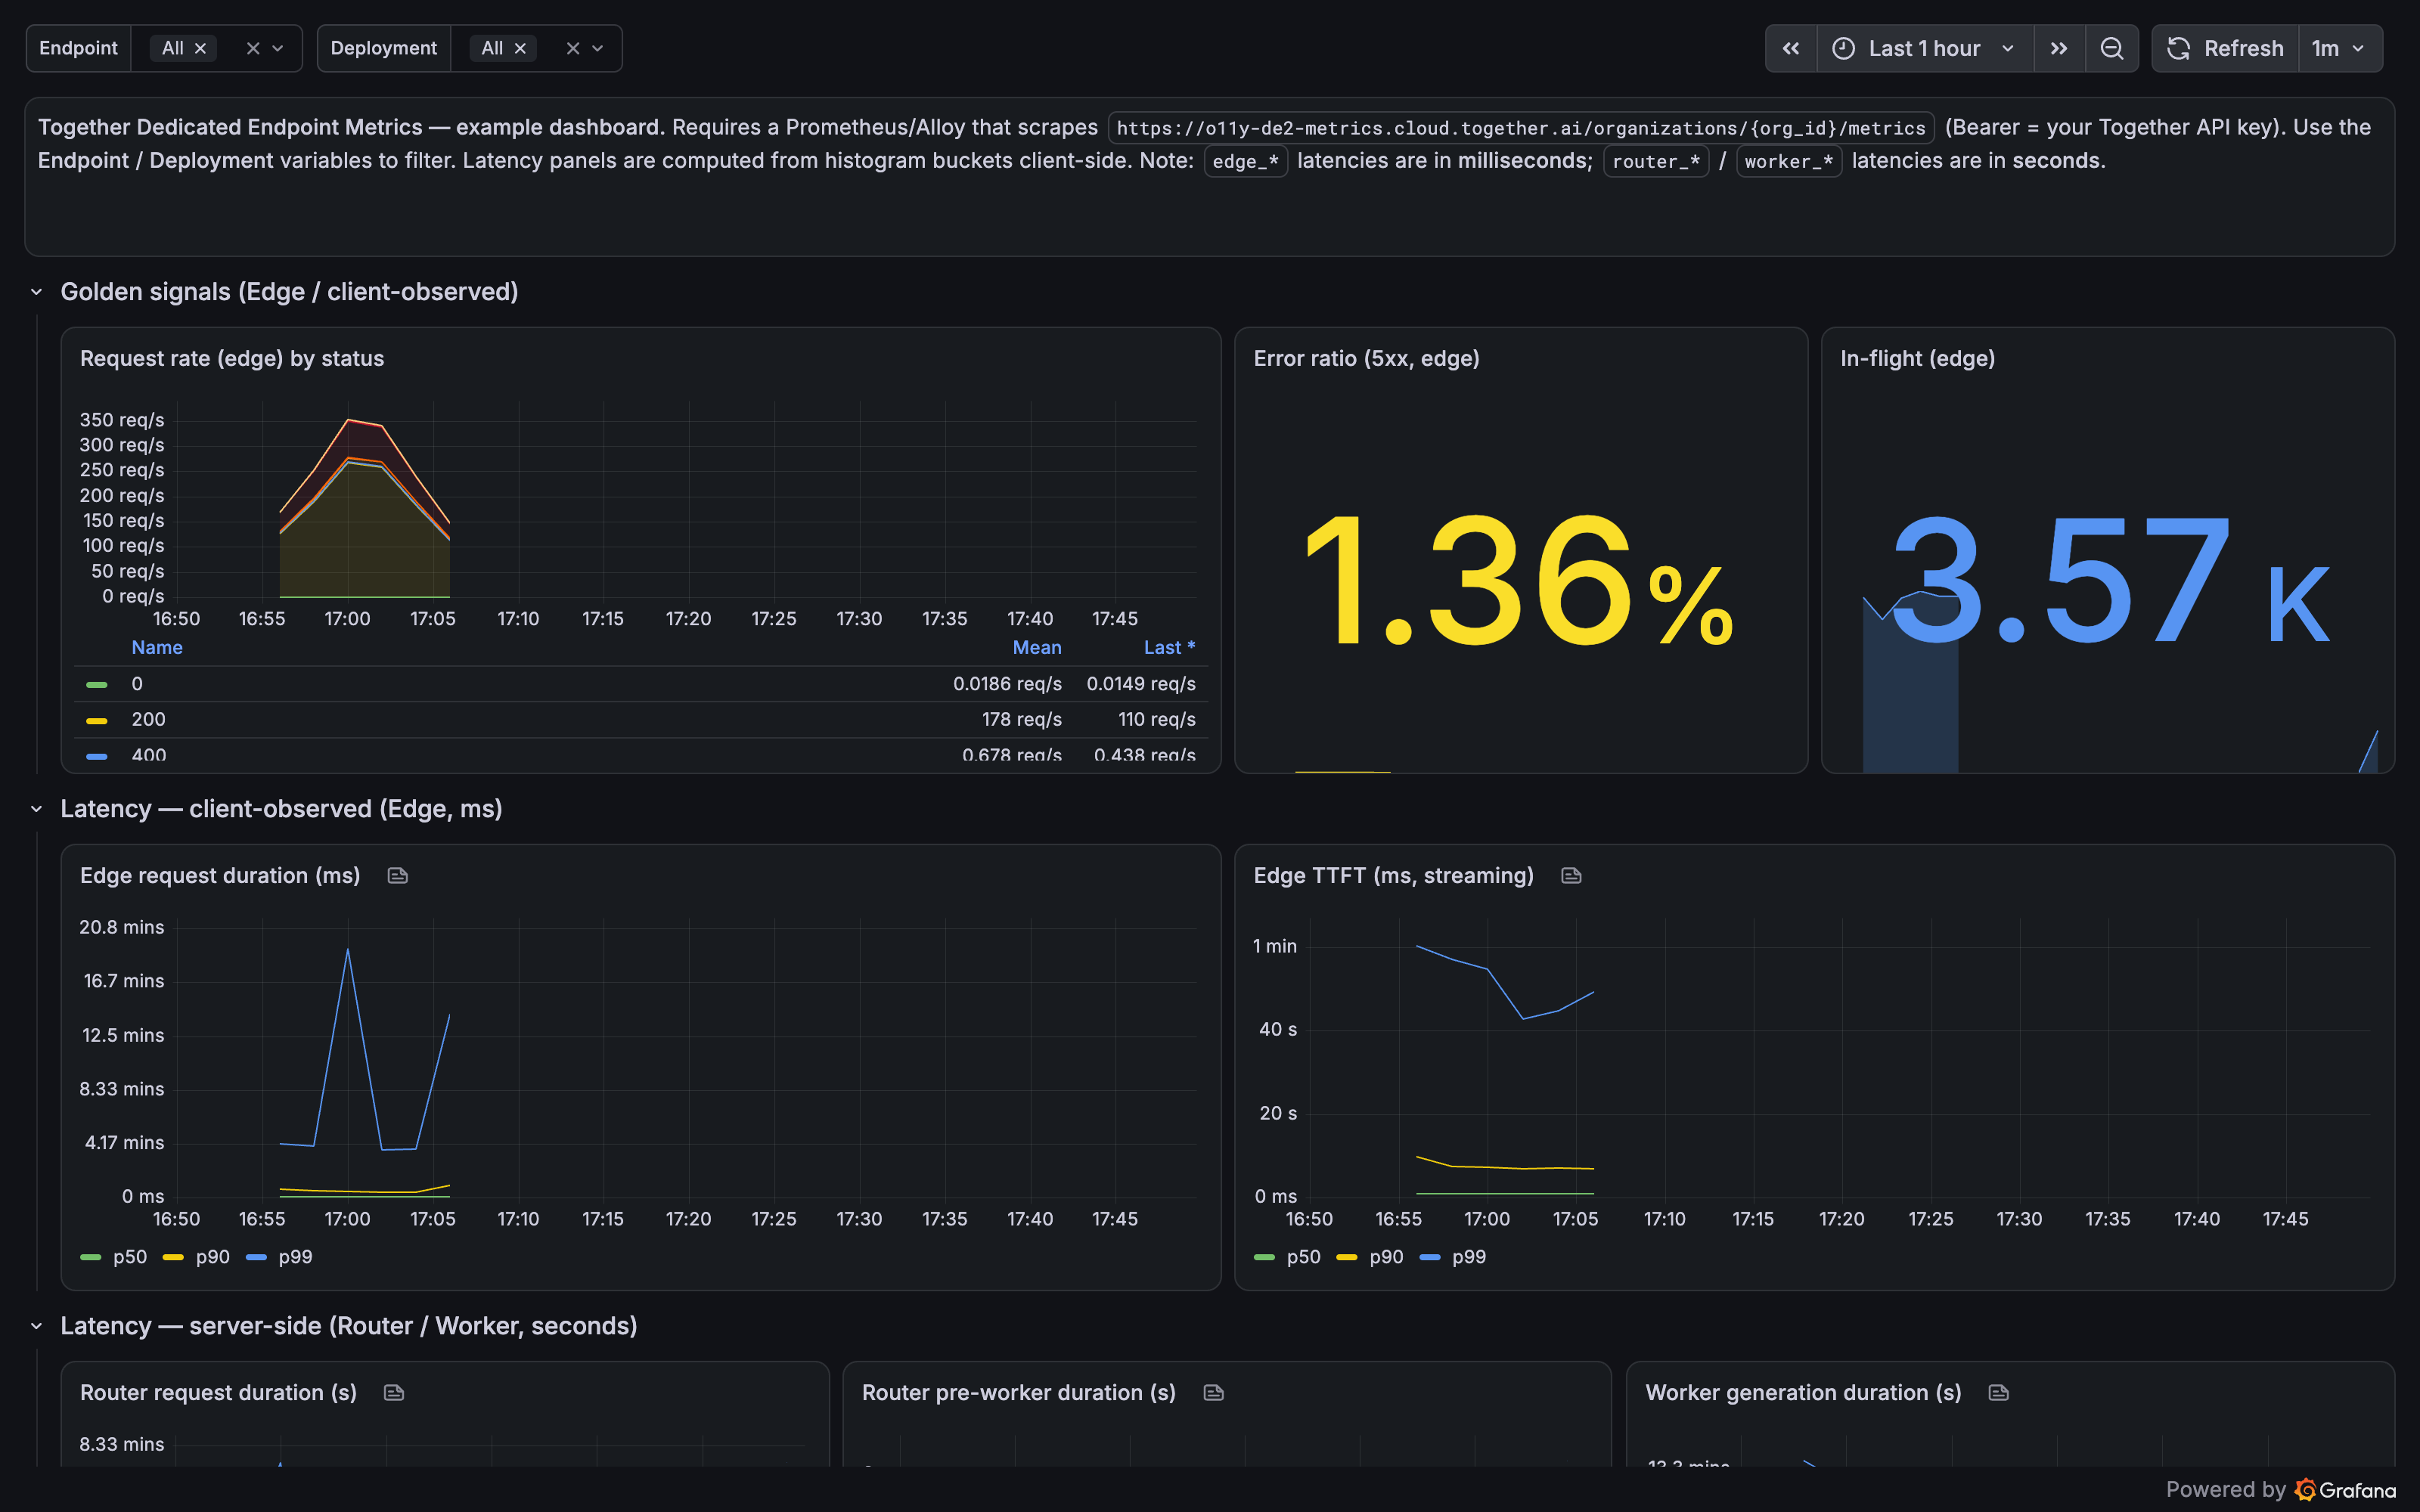
The rows follow the request path from the client inward, matching the metric groups on the monitoring page:- Golden signals (edge): Request rate stacked by status code, the 5xx error ratio, and in-flight requests, all measured at the front-door proxy. This row is the client’s view of the endpoint and the first place to look during an incident.
- Latency, client-observed (edge): Request duration and time to first token as p50, p90, and p99, computed in Grafana from histogram buckets. Edge latencies are in milliseconds.
- Latency, server-side (router and worker): Request duration at the router, pre-worker routing and queue overhead, and generation duration, time to first token, and time per output token at the worker. Router and worker latencies are in seconds, not milliseconds. A gap between edge latency and worker latency points at network or queueing overhead rather than model speed.
- Throughput and tokens: Request rate compared across the edge, router, and worker layers, token throughput by token type, and tokens per request. The layer comparison shows where requests drop when the layers disagree.
- Engine and cache (worker): KV cache utilization per deployment and the prefix cache hit rate. Sustained high KV cache utilization is a signal to scale up or out, and a low hit rate means little prefix reuse across requests.
Congrats! You’ve set up a Grafana dashboard for your dedicated endpoints.
Use a hosted Grafana instance
The same dashboard works in Grafana Cloud or any other hosted Grafana instance. Point a Prometheus-compatible collector, such as Grafana Alloy or a Prometheus instance withremote_write, at the metrics endpoint with the same scheme, path, and bearer credentials as the prometheus.yml above, then import the dashboard JSON against the data source that collector writes to.
Troubleshooting
- The Prometheus target shows a timeout or context deadline error: Organizations with many endpoints can take longer than the default timeout to scrape. Raise
scrape_intervalandscrape_timeouttogether, for example to120sand115s. - The scrape returns 401: The API key must belong to the organization in the scrape path. Check both against
tg whoami. - Panels are empty: Confirm the endpoint is serving requests, the Prometheus target is UP, and the dashboard time range covers the last few minutes. Rate panels stay empty until two scrapes have completed.
- Time-to-first-token panels are empty but others populate: The edge TTFT panel only counts streaming requests. Send requests with
"stream": true. - The Router TTFT panel is empty: This series depends on a newer router build. The panel fills in as the rollout completes, and the worker TTFT panel covers the same question in the meantime.
Next steps
Monitoring reference
The full metric and label tables behind the dashboard.
Configure autoscaling
Act on what the dashboard shows by tuning replica scaling.