

Analytics dashboard
The Together AI console shows per-endpoint charts for requests, tokens per second, input tokens, output tokens, latency, and time to first token, built on the metric series below. Open an endpoint and select the Analytics tab. Switch between Usage and Errors, view the endpoint Total or break it down By deployment, and adjust the time range. Use the dashboard to monitor an endpoint at a glance and to compare deployments during an A/B test.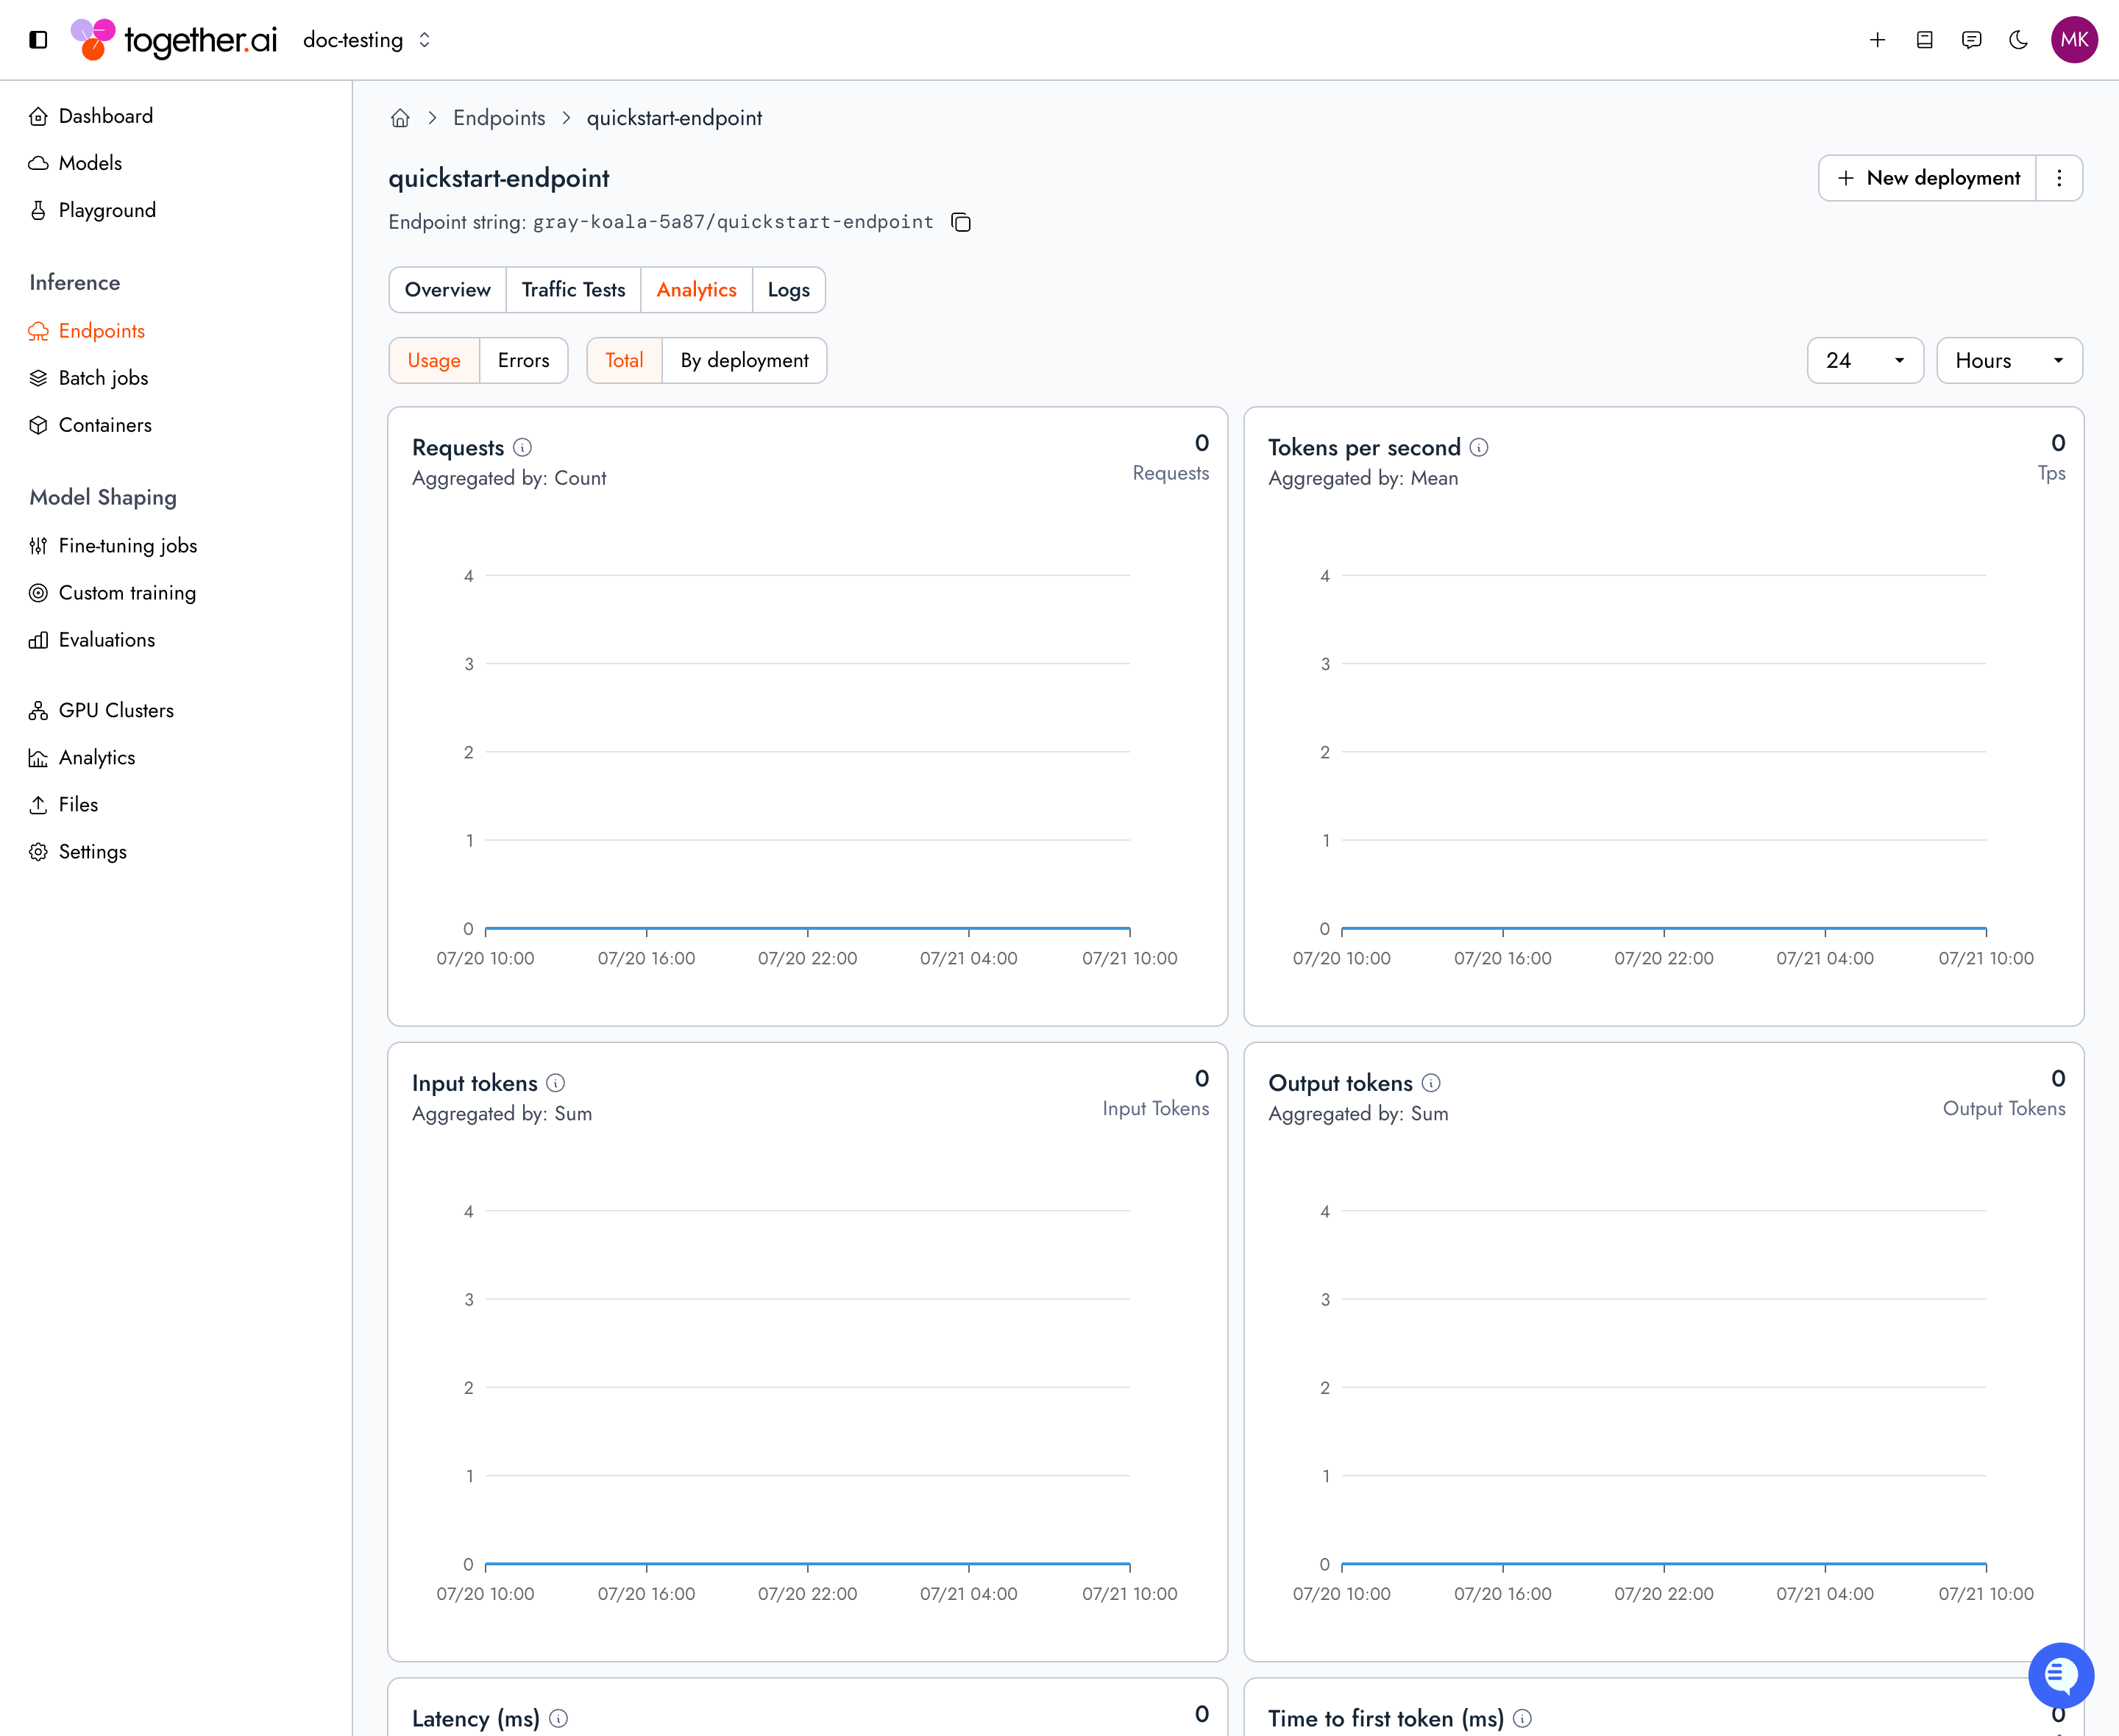
Events
Each endpoint has an audit feed of events, newest first. It merges endpoint-scoped events with the deployment-scoped events for every deployment under the endpoint, so scale-ups, traffic shifts, readiness changes, and pauses across every deployment all surface here. Use it to trace what happened during an autoscaling event or a traffic-split change. In the console, open an endpoint and select the Logs tab to browse the feed, with columns for time, type, source, level, and message.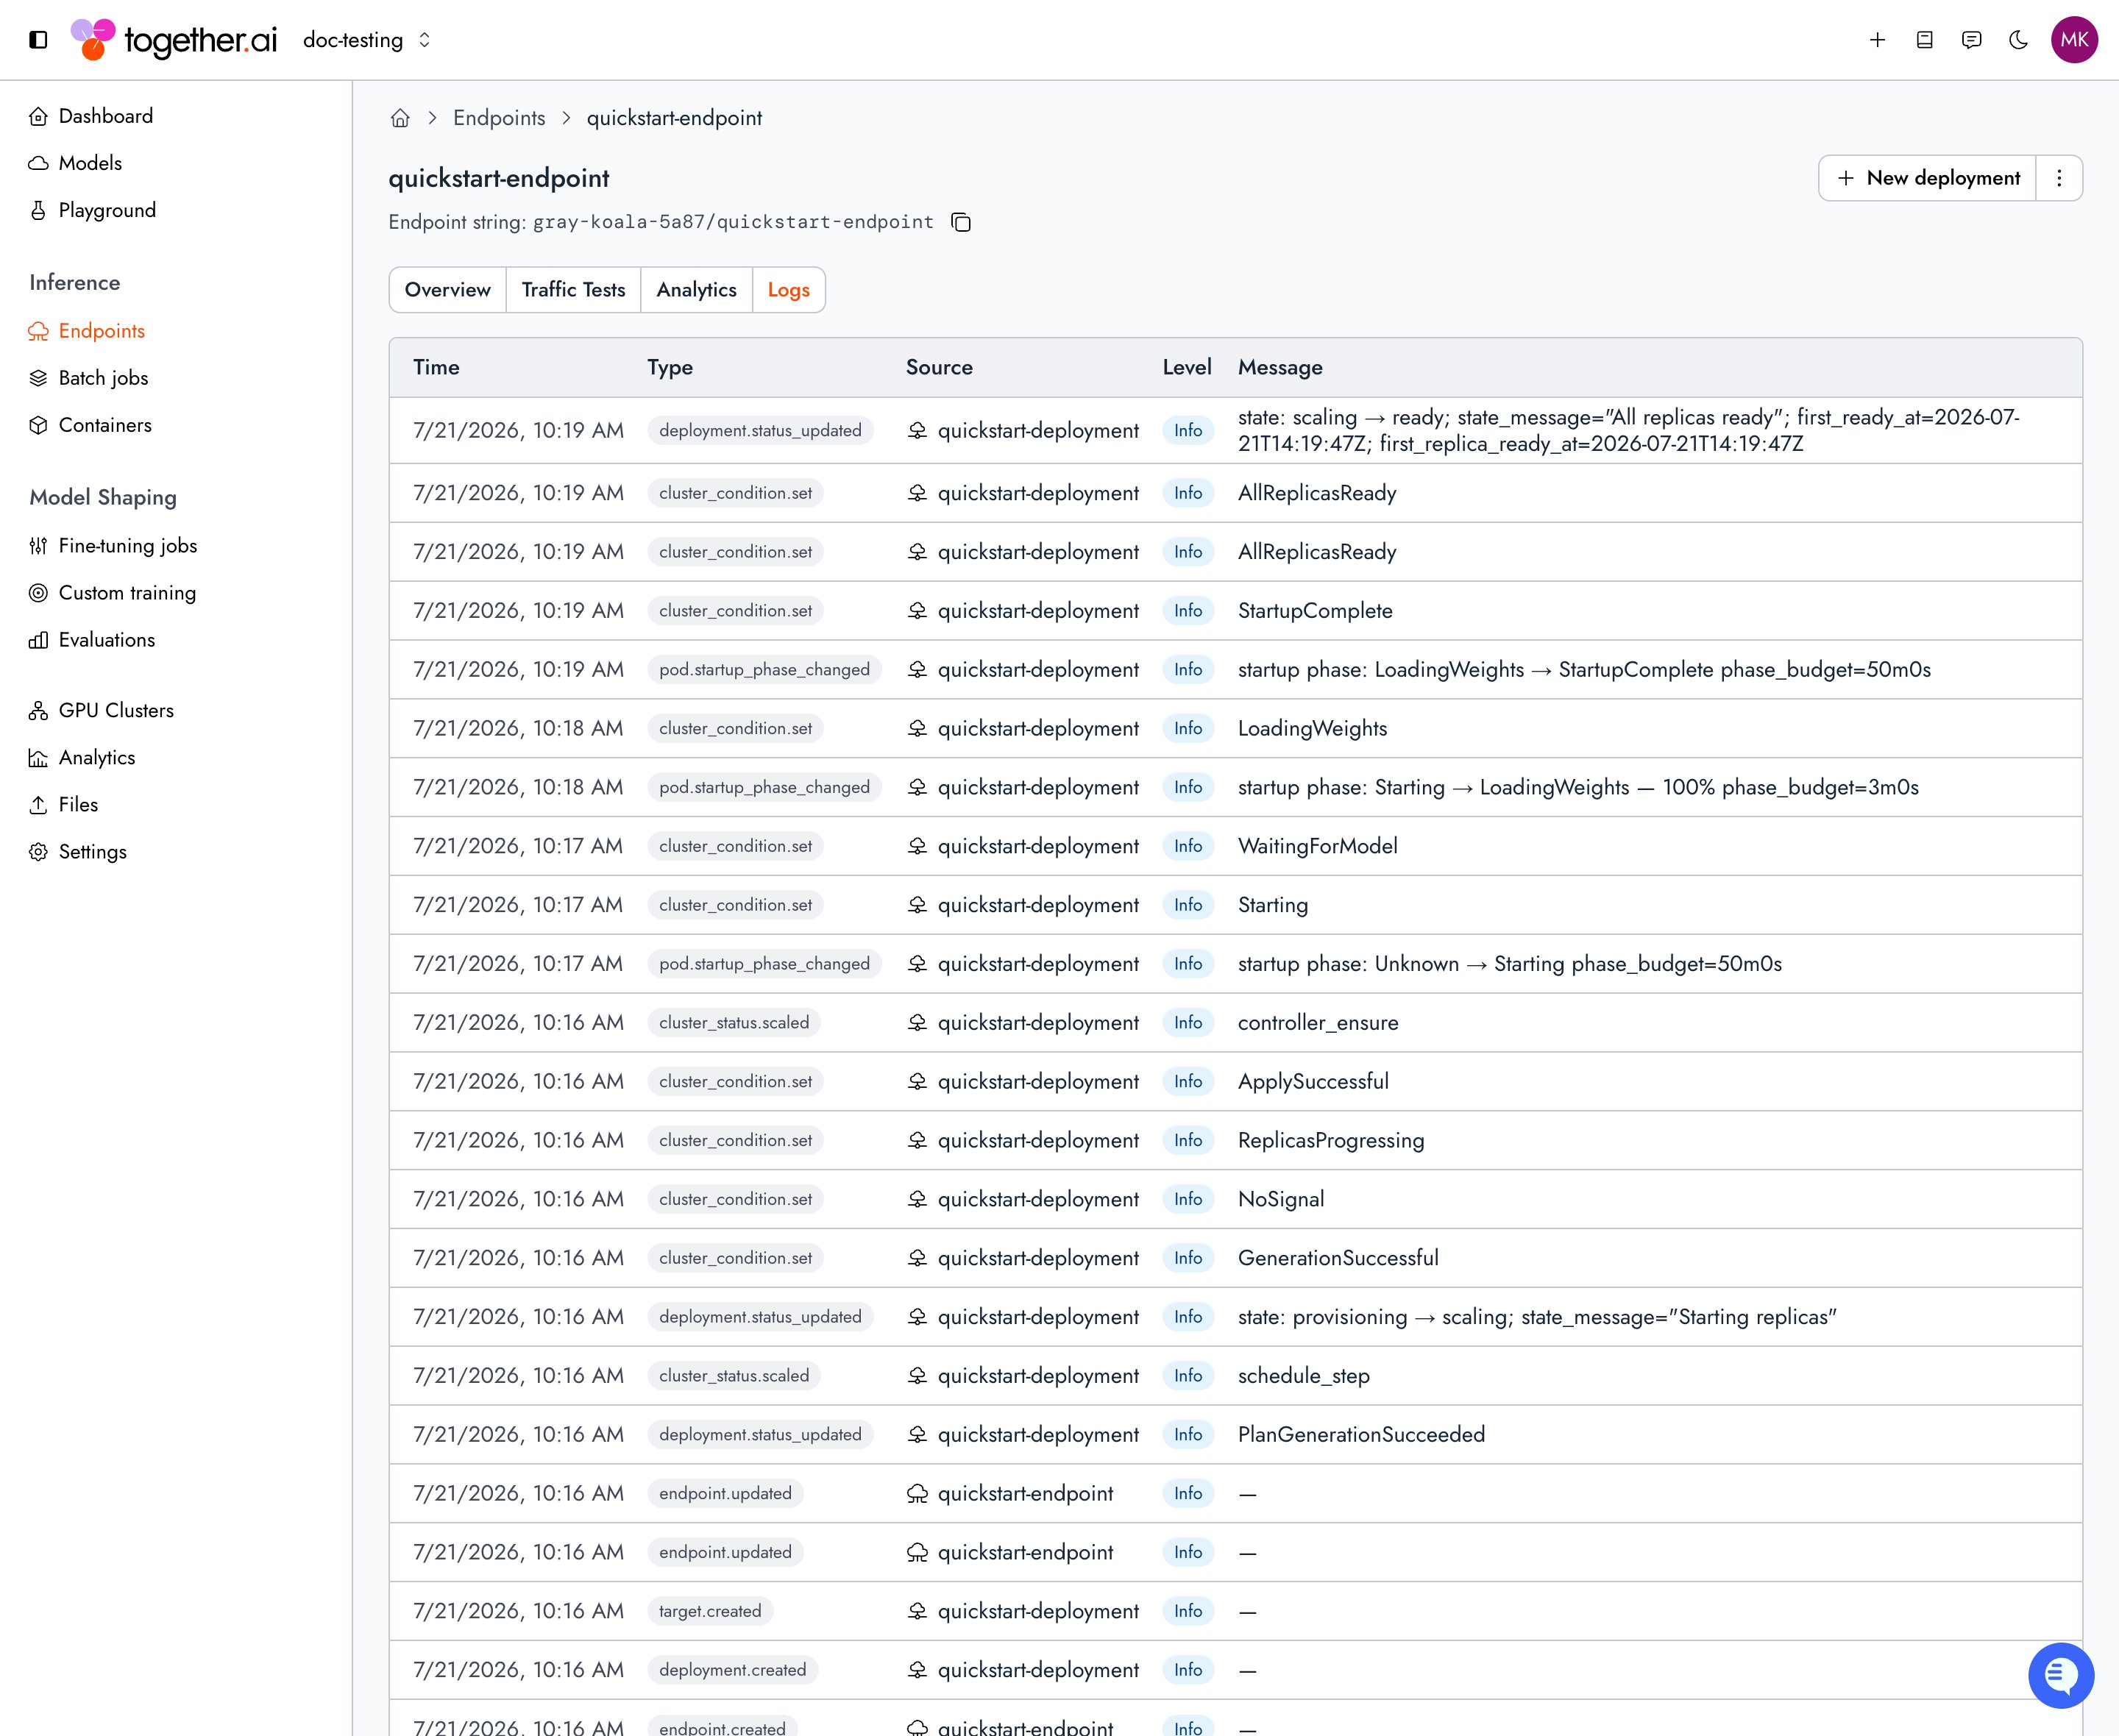
Shell
--typesrestricts to specific event-type strings, comma-separated (for exampledeployment.scaled,condition.set).--min-levelsets the minimum severity:debug,info,warn, orerror.--sinceand--untilbound a time range.--subject-idfilters to a single subject, such as a rollout ID.--deployment-idsscopes to specific deployments, comma-separated.--limitand--afterpaginate (max10000, default50). When more events remain, the CLI prints the--aftercommand for the next page.
--json for the raw event objects, including fields the table view omits. See the endpoints CLI reference for the full flag list.
Endpoint mutation events such as
endpoint.updated record when a change happened, but they don’t include a field-level diff. Keep configuration history in your deployment system if you need to reconstruct exactly what changed.Deployment events
To follow a single deployment instead of the whole endpoint, pass its ID to the--deployment-ids filter on the same events feed:
Shell
endpoint.updated, so the output covers only the listed deployments’ lifecycles.
Prometheus-compatible metrics endpoint
The metrics endpoint is in beta. The host and path below are subject to change, and access may need to be enabled for your organization. Confirm availability with your Together AI contact before you build against it.
Authentication and URL
Metrics are served per organization at:Shell
Prometheus scrape config
Point a Prometheus-compatible scraper at the endpoint:Available metrics
Metrics are grouped by the stage of the request path they measure: the edge (front-door proxy), the router, and the worker (model server). Latency metrics are histograms, exposed as_bucket, _sum, and _count series. Counters end in _total. Gauges are point-in-time values.
Edge (front-door proxy)
Router
Worker (model server)
Labels
Series carry labels that identify the resource and slice the data. Not every label appears on every metric.Next steps
Visualize metrics in Grafana
Scrape the metrics endpoint and import the example dashboard.
Configure autoscaling
Pick a metric to autoscale a deployment on.
Route traffic
See how the endpoint routes requests across deployments.
Gate rollouts with metrics
Pause a rollout automatically when a new deployment regresses on live metrics.